
Project 1: Customer Profiling Using Cluster Analysis
Designed and built a dashboard for stakeholders of a Telecomms company showing the 4 tiers of customers based on data subscribed and bonus usage using cluster analysis.
Check it out
I love to explore the relationships between numbers, translate digits and spreadsheets into stories. These stories then become actionable solutions for businesses. Adept in writing queries, reports, presenting findings and making recommendations.
Learn more
Designed and built a dashboard for stakeholders of a Telecomms company showing the 4 tiers of customers based on data subscribed and bonus usage using cluster analysis.
Check it out
Performed an in-depth analysis of a toy company's sales data to extract key insights. Created and published a Power BI report tailored to stakeholder needs, with a focus on report performance, dax query optimization and data security.
Check it out
This is a Power point presentation showing results of our analytical findings at the end of each statistical test. All statistical tests were done using IBM SPSS.
Check it out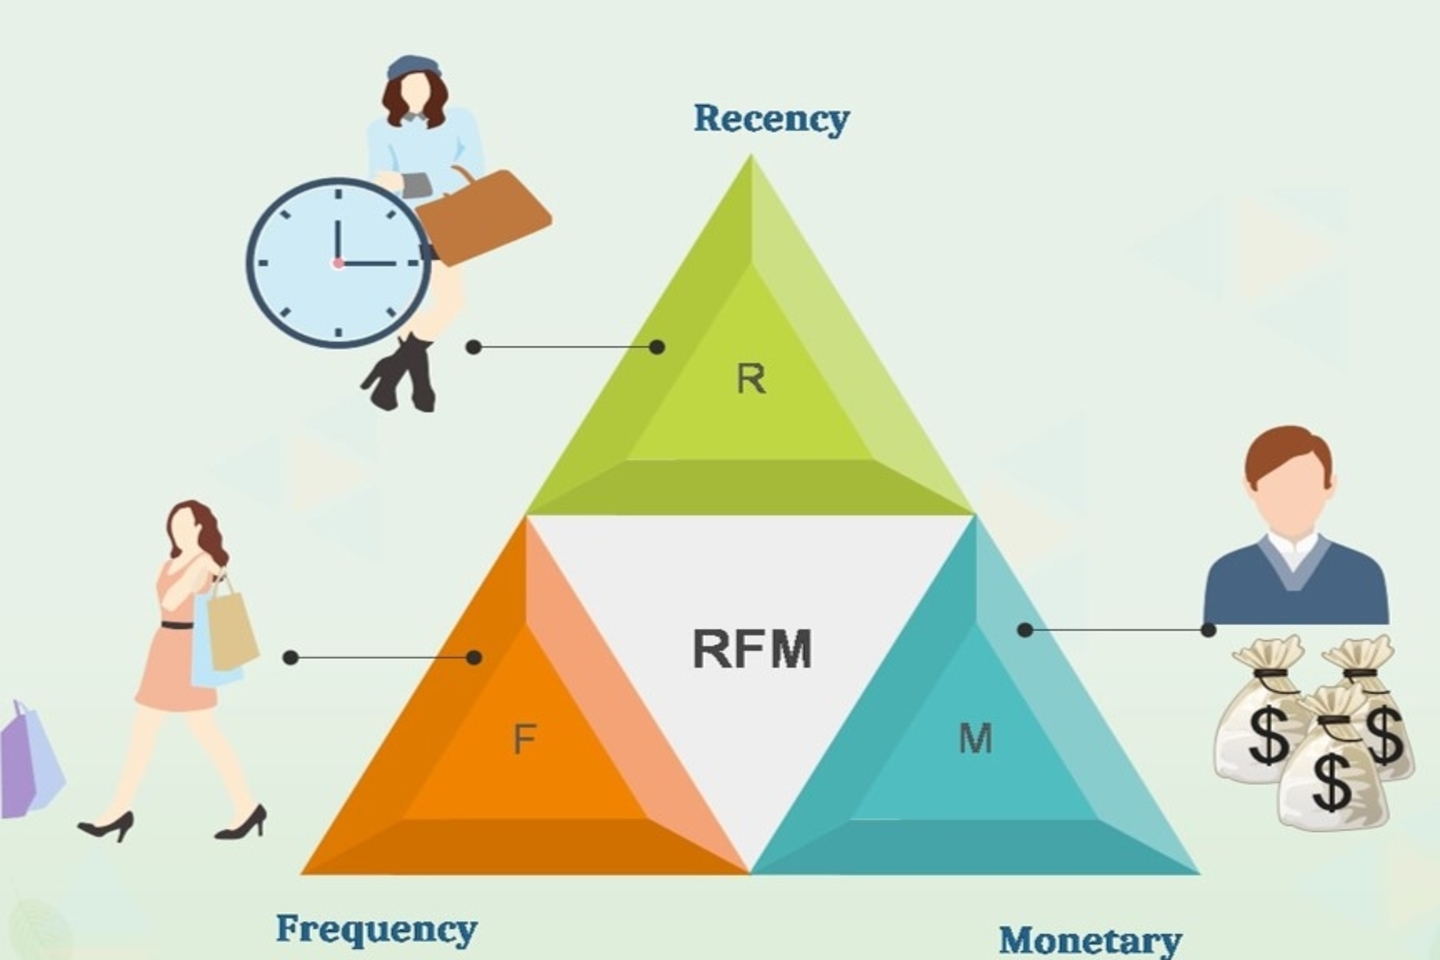
RFM analysis was done to better understand consumer behaviour by segmenting them based on thier purchasing patterns or habits. It evaluates customers’ Recency (how long ago they made a purchase), Frequency (how often they make purchases), and Monetary value (how much money they spend)
Check it out
Click below to view details
Check it out
This is a write-up explaining how I typically set up a parameter and a function using M Code in Power Query to facilitate the dynamic switching of data sources, should the need arise.
Check it out
Click below to view details
Check it out
This is a collection of SQL queries written by me while working on analytical projects, including scalar functions, aggregate functions, window functions and stored procedures.
Check it out
A collection of jupyter notebooks containing analytical insights, using libraries such as Pandas,Numpy,Matplotlib & Seaborn for analysis.
Check it out